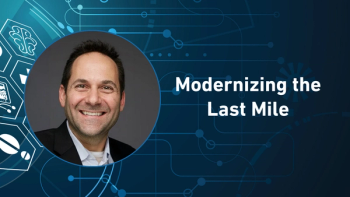
Making Connections: Dr. Alexander Jarasch
Former head of data management and knowledge management at Germany’s National Center for Diabetes Research, Dr. Alexander Jarasch outlines his ideas around the future of AI and data management in the pharma and healthcare space
This month at Pharma Data UK in London (8–9 September),
Dr. Jarasch was until very recently head of data management and knowledge management at Germany’s National Center for Diabetes Research (DZD). He has since joined native graph database leader
Pharma Commerce caught up with Dr. Jarasch after the event to further discuss the future of clinical investigation, AI and data management in the pharma and healthcare space, and how his new role will combine pharma with technology.
Pharma Commerce: What key changes have you seen over the course of your career in data management—and particularly during your last few years at Germany‘s National Center for Diabetes Research (DZD)?
Dr. Alexander Jarasch: In my career, which started in academia, then moved to the chemical industry, then pharma, a constant theme has been the ever-growing demand for data. Each and every company or institution—not just the ones I’ve personally been connected with, but across the board—is gathering more and more data to understand things or processes in a deeper way.
But as you accumulate more and more data, the problem of how to store it and access it gets more and more pressing, and as scientific data management professionals we all want to abide by
On the other hand, it has become clear that if you see data as a point in a kind of very abstract coordinate system, that isn’t enough either. To deliver its true value to pharma and medicine, we need to bring context back into data.
In fact, that’s what I addressed in my last position at the DZD—working on surfacing context again by opening up the connections between diabetes and not just diet, but also diseases like cancer. More and more, when we talk about COVID and cardiovascular disease and diabetes, there are clear inter-connections we need to know more about.
This need for better understanding relationships and connections is why I think from a technical point of view, graph databases will be a game-changer for the sector.
Going back a step, how did you become interested in life sciences as a career?
From boyhood, I was really good at Biology as well as Chemistry, but I liked computers. I could see my sister was studying Biology further along than me in school, but she seemed to be learning a lot of Latin names for plants and animals, and I knew I didn't want to do that—I wanted to be more technical.
So, I came into life sciences with a strong foundation in structural biochemistry but a definite interest in how the application of computer science could make a practical difference. I’d say that all the way through my career it’s always been about application; I want to help produce things that could return a big yield or really move the needle for patients. That was and to this day remains my motivation.
What were you proudest to be associated with in terms of harnessing data to help research?
I‘m very proud of making data available to scientists, wherever I’ve worked. That’s because it’s the scientists who help develop the drugs or therapies we need or find ways to get to accurate diagnoses quicker.
DZD made real advances by using data better, and I was happy to address the data handling and storage issues for them and create a service that enabled other people via data technology to improve healthcare or be part of accelerated drug discovery processes.
The core goal at DZD was to connect data from basic research with clinical data. Basic research starts with chemistry and lab experiments and at the start has nothing to do with the patient—but in the end it absolutely does. There are a lot of steps to translate that research and what you’ve found through it to the patient, and that can only happen if you make the right connections between different fields and studies. That was at the heart of all we did with data at DZD, including what graph technology opened up for us.
How did COVID-19 impact DZD’s activities?
Like everyone else, we had to scramble to make homes into offices and digitize very quickly so that all the team could work securely, safely, and productively remotely. There was a huge amount of behind-the-scenes work to make that happen.
From a medical perspective, COVID had a big impact on all our work in parallel, because diabetes is a comorbidity of COVID-19 so diabetic patients had a higher risk of getting infected and dying. There are just so many other links to other diseases and conditions and all these long-term complications of COVID. To properly understand those connections, we had to connect so much data and understand these relationships.
By the way, underneath all the terminology we use, the real reason graph databases are so welcome to researchers in our industry is that they are so intuitive. Graph technology is a way to put into code what we do when we work on a whiteboard–drawing circles (things/entities) that are connected by lines (relationships). It avoids all the difficulty of trying to stop be naturalistic and try and force your question into rows and columns, i.e., into relational databases. We need to spread the word about that in the community so more people get involved and see there's a technology out there that is the same as whiteboarding but also a fantastic basis for real data science.
You and your team constructed a special “COVIDGraph” that proved highly useful in the search for a vaccine and effective treatments during the first wave of the disease. Can you share some insights into this application of graphs to this challenge?
With COVID and really in everything DZD looks at, our goal was to link everything together and to make data easily accessible and visually appealing, and this is where graph technology came into play. Connecting different siloed datasets makes a lot of sense but is a big challenge, because the datasets are so huge, and the data is very complex with a lot of text so there's no real structure behind it.
We have to always remember that a medical doctor is not a computer scientist—they don't have training on querying data from a database, so you have to have something where that data makes sense for them. That's one of the biggest challenges in data and life sciences then and now to get the user involved and make findings easily accessible.
Let’s make that a bit less abstract. A group of doctors in Germany are very interested in hemostasis and what kind of genes and molecular pathways are involved in that, and for a period there was a real drive to see if there was anything in the literature about hemostasis and platelet production. Before our COVID graph platform, doctors were trying to get that information from five or 10 different databases, which was really impossible. With a graph database, we just connected all that information for them and it was easy to browse through that.
Another example was that we had 130,000 publications to wade through on the database that might contain useful information on the action of a very specific gene. Nobody‘s ever going to read that and understand all the connections. We worked to enable the scientist to quickly get the core information they wanted about that gene, and then used graph data science to identify the gene that was most mentioned. This led to the discovery of new COVID targets much more quickly than it would have been otherwise.
How will working in the technology sector— specifically in your new role at Neo4j— help you pursue your AI and data management ambitions, and potentially advance analytics in pharmaceuticals?
I think my role at Neo4j is to enable customers with all the great new techniques emerging from thinks like knowledge graph and graph data science and ontologies and so on to make sense of the data. In pharma we want to learn more and more about a subgroup of patients to provide more, or better, individualized or precision medicine, which means a lot of unstructured data and for that, graph databases and graph data science is emerging as key. And that’s what I want to do: enable our customers.
If we spoke to you again in 12 months, what would you like to have achieved in this new role?
To me, that's such an important point—by connecting unstructured pharma and medical research data you also connect so many others, from scientists to marketers and regulators. You’re bringing people together to let people speak together and enable potentially something much, much bigger than the “data.”
In the end, I want to see life sciences people be successful. My next few months at Neo4j will be about clearing the way for the connections, not just in our data but in our sector that will make a difference to all our stakeholders.
Newsletter
Stay ahead in the life sciences industry with Pharmaceutical Commerce, the latest news, trends, and strategies in drug distribution, commercialization, and market access.


